Bitcoin rose 1.39% in a day, so why did five of ten indicators say down?
A beginner's guide to reading a chart when the signals disagree, with a real example from 16 October 2026.
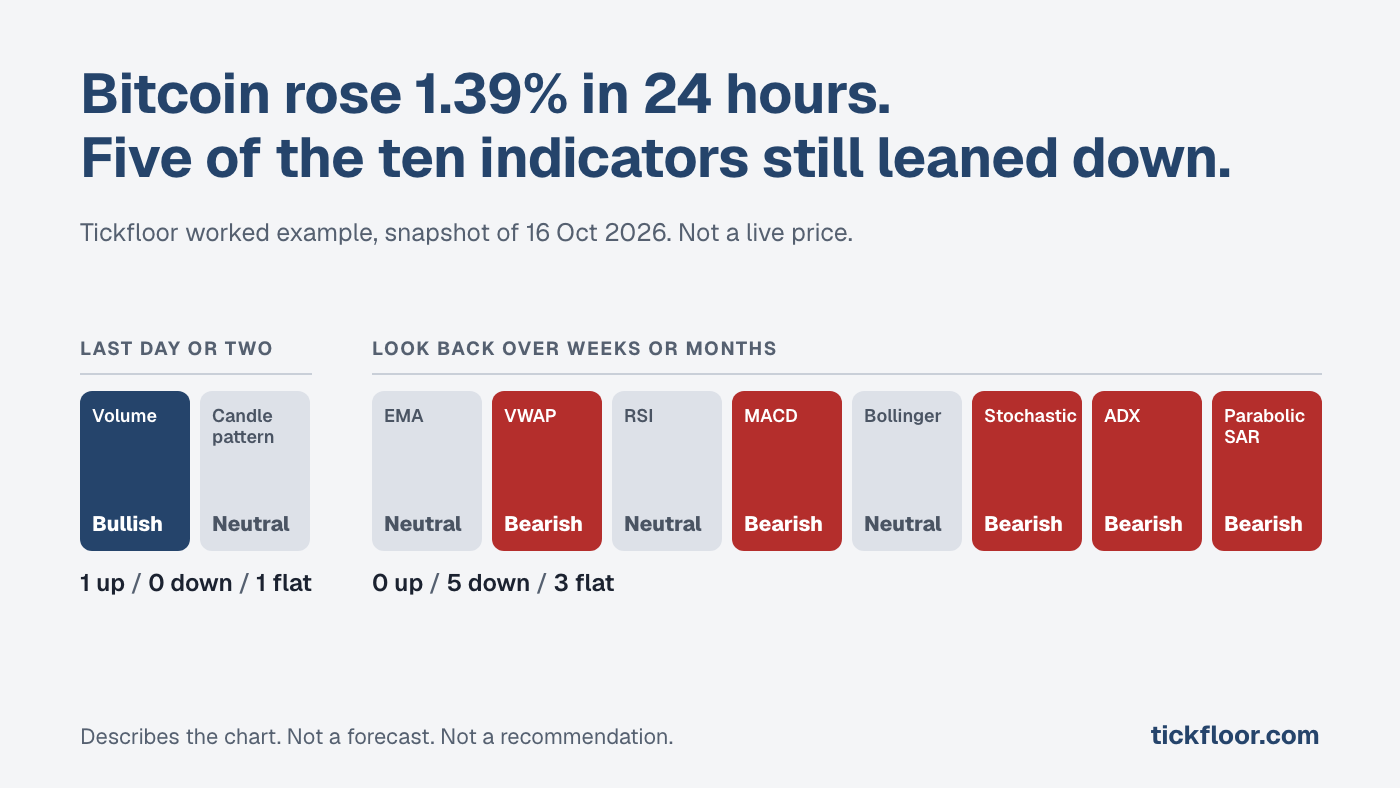
On 16 October 2026 we took a snapshot of Bitcoin. Over the previous 24 hours the price had gone up 1.39%. Even so, five of our ten indicators said bearish, which means they leaned down. One said bullish (leaned up) and four had no view.
That sounds like a contradiction, but the ten indicators do not all look at the same stretch of time.
The ten indicators
An indicator is a simple calculation done on past prices. Tickfloor runs ten of them on any stock or crypto ticker. (A ticker is the short code for something you can buy, like AAPL for Apple.) Each indicator answers one question with bullish, bearish or neutral, which means no clear view.
Two clocks
Think of the ten as two clocks. The fast one covers the last day or two. The slow one looks back over weeks or months.
Two indicators run on the fast clock. Volume, meaning how much was traded, asks whether the last day was busier than usual and the price closed higher than it opened. Candle pattern looks at the shape of the latest candle. (A candle is one day of trading drawn as a small box: where the price opened, where it closed, and how high and low it went.) In the snapshot, Volume said bullish and Candle pattern had no view.
The other eight run on the slow clock. VWAP is the average price people paid over the last 20 days, with busier days counting for more, and it asks whether the price now sits above or below that. MACD asks whether momentum, meaning how fast the price is moving, is building or fading. ADX asks whether there is a real trend (a steady run in one direction) and which way it points. Of these eight, five said bearish, three had no view and none said bullish.
So the last day looked strong while the weeks before it did not. A student whose grades slid all term can still score 90% on one test. The 90% counts, and the slide still happened. Whether the strong day is the start of a turn or a blip, the indicators cannot say.
Reading a mixed result
Do not squash it into a single verdict. Ask which indicators disagree and why, then look at the price chart to see if you can spot the same split by eye.
Neutral does not mean bearish. It means that indicator could not see a clear answer, and four of the ten could not.
The score out of 10 is the ups minus the downs, so one up and five down gives -4. Tickfloor's own note says that number can jump several points in a day, so look again later instead of treating it as fixed.
What it can't tell you
It cannot tell you what Bitcoin does next. We tested 1,342 trading rules on past data, and after allowing for how many we tried, 0 passed the luck check. Those are in-sample backtests, not a promise. So a score describes the chart and nothing more.
Try it on a ticker you follow
Type a stock or crypto ticker, such as AAPL or BTCUSDT for Bitcoin, into the free score. You get all ten answers, the score and a price chart. The score uses daily candles, so it describes the last full day, not this minute. It shows every answer instead of one Buy or Sell label, so a split like the one above stays visible. The free tier is 3 free scores a day with a free account, no card.
The snapshot above was taken on 16 October 2026 and is not a live price. Tickfloor's worked example page has been updated since, so it no longer shows these readings.
About Tickfloor
What is Tickfloor?
Tickfloor is a stock and crypto indicator for beginner and self-directed traders: it scores any stock or coin out of 10 from ten common chart checks, and publishes every backtest behind the method, the failed ones too. So far that is 1,342 strategies tested, and 0 passed the luck check.
Is Tickfloor free?
Yes, to start. You get 3 free scores a day with a free account. No card. The example read, the evidence and results pages, the glossary and the first two course lessons need no account at all. Paid passes unlock the rest and are listed on the pricing page.
How is Tickfloor different from other indicator sites?
Tickfloor shows its own test record next to the score, failures included: 1,342 strategies in 77 families against a benchmark that pays no costs. 265 finished ahead on the raw number and 0 of 1,774 tests were left once luck was allowed for. The score describes what a chart shows today. It is not a tip or a prediction.
General information, not personal advice. Tickfloor does not hold a financial services licence.