Bollinger Bands explained for beginners, and how four band rules did on past data
What the three lines mean, why a close below the lower band looks like a bargain, and what the numbers said.
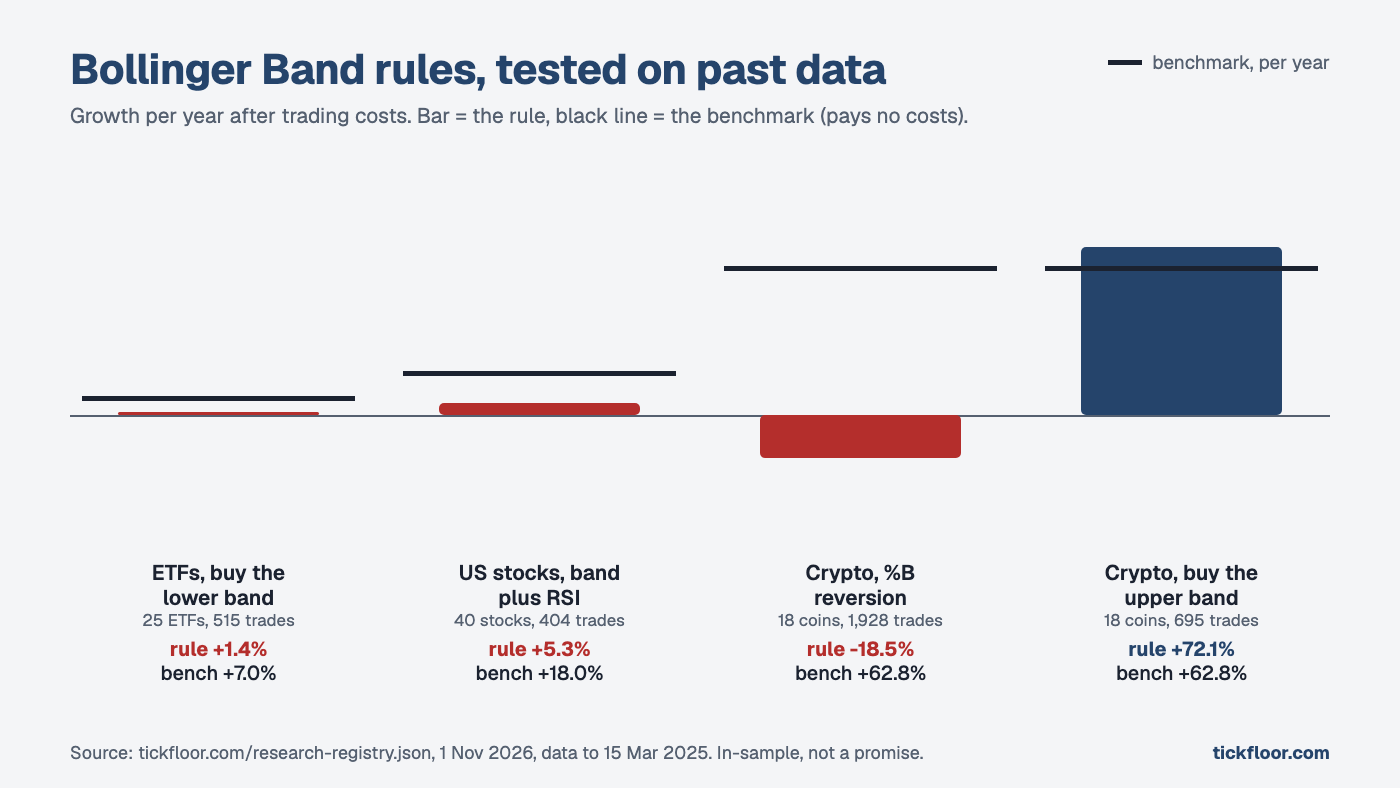
Buying a stock when it drops below its lower Bollinger Band is one of the first tricks beginners find online. We tested it. On 25 ETFs over 20 years it grew 1.4% a year after costs, while the benchmark grew 7.0%.
Here is what the bands are, so those numbers make sense.
Start with 20 days of closing prices
Say a stock's last 20 closing prices average $100. On a typical day it closed about $2 away from that average, sometimes above, sometimes below. Statisticians call that typical distance the standard deviation. (It is a bit more careful than "typical distance", but close enough for what follows.)
Bollinger Bands draw three lines. The middle line is the 20-day average, $100. The upper line is the average plus two standard deviations, $104. The lower line is the average minus two, $96.
That is the whole indicator. The 20 and the 2 are the usual settings, and charting apps let you change them. John Bollinger created the bands.
What the bands tell you
When a stock gets jumpy, the typical distance grows and the bands spread apart. When it goes quiet, they squeeze together. So the bands show how jumpy price has been. They do not point up or down.
If prices followed a bell curve, about 19 closes in 20 would land inside the bands. Real prices have more big jumps than a bell curve allows, so closes outside the bands show up more often than that maths suggests.
Three ways people use them
- The bounce: price closes below the lower band, looks stretched, and the idea is to buy, expecting a snap back toward the middle line.
- The breakout: price closes above the upper band, which people read as strength, and the idea is to buy.
- The squeeze: the bands get very narrow. A bigger move may be coming, but the bands do not say which way.
How we tested them
We coded each rule, charged trading costs on every trade, and ran all of them through the same harness on past data ending 15 March 2025. The benchmark is an equal-weight mix of the same assets, rebalanced daily, and it pays no costs. That makes it harder to beat than it sounds.
Growth per year, rule against benchmark:
- Buy a close below the lower band (20 days, 2 deviations), 25 ETFs, 2005 to 2025, 515 trades: 1.4% against 7.0%.
- Same idea plus RSI under 30, 40 US stocks, 404 trades: 5.3% against 18.0%.
- Crypto %B reversion (a close near or below the lower band), 18 coins, 2017 to 2025, 1,928 trades: negative 18.5% against 62.8%.
- Buy a close above the upper band, 18 coins, 695 trades: 72.1% against 62.8%.
These are in-sample backtests on past data, not a promise.
The one that finished ahead
The upper-band rule beat the benchmark by 9.3 points a year. Before getting excited, look at its p-value, 0.41. A result that good would show up by luck alone about 4 times in 10. And we tried a lot of rules.
Across all 1,342 strategies we tested, 265 finished ahead of the benchmark on the raw number. After correcting for how many we tried (Benjamini-Hochberg, across 1,774 tests), 0 passed. That does not prove nothing works. It means we cannot tell this one apart from luck.
What the bands are good for
Seeing how jumpy price is right now. The width helps when you pick a stop: a stock that swings $4 a day needs more room than one that swings $1.
We only tested the usual 20-day, 2-deviation setting. Other settings may behave differently, and we do not know how.
Bollinger Band position and width are two of the ten inputs behind a Tickfloor score. You can try a free score on a stock or coin: 3 free scores a day with a free account, no card. The full Bollinger tests, with every trade count, are in the Bollinger Band bounce test.
About Tickfloor
What is Tickfloor?
Tickfloor is a stock and crypto indicator for beginner and self-directed traders: it scores any stock or coin out of 10 from ten common chart checks, and publishes every backtest behind the method, the failed ones too. So far that is 1,342 strategies tested, and 0 passed the luck check.
Is Tickfloor free?
Yes, to start. You get 3 free scores a day with a free account. No card. The example read, the evidence and results pages, the glossary and the first two course lessons need no account at all. Paid passes unlock the rest and are listed on the pricing page.
How is Tickfloor different from other indicator sites?
Tickfloor shows its own test record next to the score, failures included: 1,342 strategies in 77 families against a benchmark that pays no costs. 265 finished ahead on the raw number and 0 of 1,774 tests were left once luck was allowed for. The score describes what a chart shows today. It is not a tip or a prediction.
General information, not personal advice. Tickfloor does not hold a financial services licence.