We tested 19 versions of MACD. One finished ahead, and we still don't trust it
What the three MACD lines are, and what past data says about trading the crossover.
One MACD rule beat the benchmark. Daily crypto, 18 coins, 1,382 trades: it grew 80.5% a year after costs while the benchmark grew 62.8%. It also fell 49% at its worst, against 86% for the benchmark. Sounds like a win. We still do not trust it, and by the end you will see why.
First, what MACD is.
Two averages and a gap
MACD (say "mack-dee") stands for moving average convergence divergence. Gerald Appel came up with it in the late 1970s. It uses three numbers.
Take the 12-day exponential moving average of a price. That is an average that counts recent days more than old ones. Take the 26-day one too. Subtract the 26 from the 12 and you have the MACD line. Say the 12-day is at $105 and the 26-day is at $100. The MACD line reads 5.
Then take a 9-day average of the MACD line itself. That is the signal line. The gap between the two lines is the histogram, the little bars under the chart.
How people trade it
The usual rule: buy when the MACD line crosses above the signal line, sell when it crosses back below. Variations are everywhere. Only take crosses above zero. Wait for the histogram to tick up. Add RSI. Add a 200-day average.
We coded 19 of them.
What happened
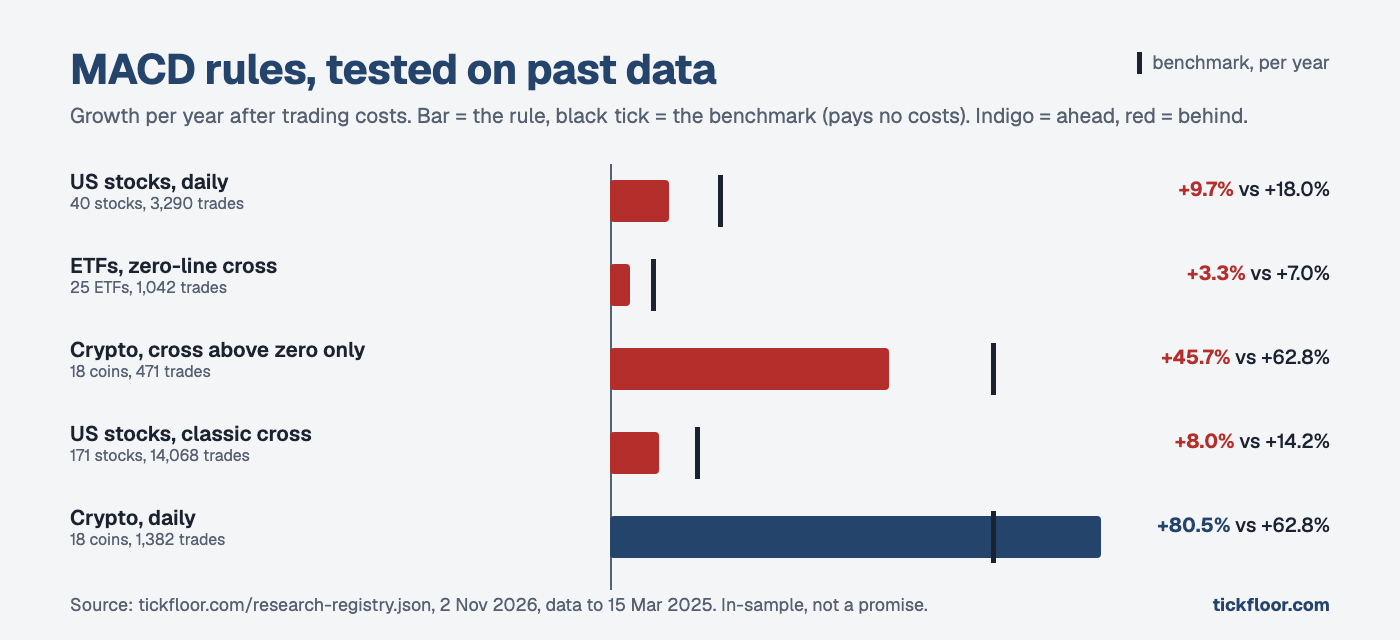
Growth per year after trading costs, rule against benchmark. The benchmark is an equal-weight mix of the same assets, rebalanced daily, and it pays no costs, so it is hard to beat:
- Classic MACD line above signal, 40 US stocks, 3,290 trades: 9.7% against 18.0%.
- Zero-line cross, 25 ETFs, 1,042 trades: 3.3% against 7.0%.
- Cross taken only above zero, 18 coins, 471 trades: 45.7% against 62.8%.
- Classic cross, 171 US stocks, 14,068 trades: 8.0% against 14.2%.
- Classic line above signal, 18 coins, 1,382 trades: 80.5% against 62.8%.
The first four finished behind. The fifth is the exception. Of all 19 rules, 18 finished behind. The worst was an hourly scalp combo with 45,587 trades, which lost 158 points a year to the benchmark. Costs ate it.
Why we don't trust the winner
The same rule on US stocks finished behind. Same settings, same logic, different market, opposite result. That is what luck looks like, and it is also what a crypto-only quirk looks like. We cannot tell which.
The number that matters is the p-value, 0.27. A result this good would show up by chance alone about 27 times in 100. And we did not run one test. Across all 1,342 strategies we tested, 265 finished ahead of the benchmark on the raw number. After correcting for how many we tried (Benjamini-Hochberg, across 1,774 tests), 0 passed, and that includes this one.
The smaller fall is real in the data, and we would not wave it away. A rule that sits out part of the market will fall less. Whether that is skill or just time spent in cash, we have not separated.
What MACD is good for
Reading momentum at a glance: the gap widening means the move is speeding up, shrinking means slowing. As a standalone signal on 25 ETFs or 171 US stocks, it trailed in every version we tried.
We only tested the 12, 26, 9 setting for the plain versions. Other settings may behave differently, and we do not know how.
MACD is one of the ten inputs behind a Tickfloor score. You can try a free score on a stock or coin: 3 free scores a day with a free account, no card. Every MACD test, with trade counts, is in the MACD crossover test.
These are in-sample backtests on past data, not a promise.
About Tickfloor
What is Tickfloor?
Tickfloor is a stock and crypto indicator for beginner and self-directed traders: it scores any stock or coin out of 10 from ten common chart checks, and publishes every backtest behind the method, the failed ones too. So far that is 1,342 strategies tested, and 0 passed the luck check.
Is Tickfloor free?
Yes, to start. You get 3 free scores a day with a free account. No card. The example read, the evidence and results pages, the glossary and the first two course lessons need no account at all. Paid passes unlock the rest and are listed on the pricing page.
How is Tickfloor different from other indicator sites?
Tickfloor shows its own test record next to the score, failures included: 1,342 strategies in 77 families against a benchmark that pays no costs. 265 finished ahead on the raw number and 0 of 1,774 tests were left once luck was allowed for. The score describes what a chart shows today. It is not a tip or a prediction.
General information, not personal advice. Tickfloor does not hold a financial services licence.