Research
Alphabet's finances, and what holding GOOG would have done
Alphabet's revenue, profit, cash flow and debt from SEC filings, and what holding GOOG would have done in the past.
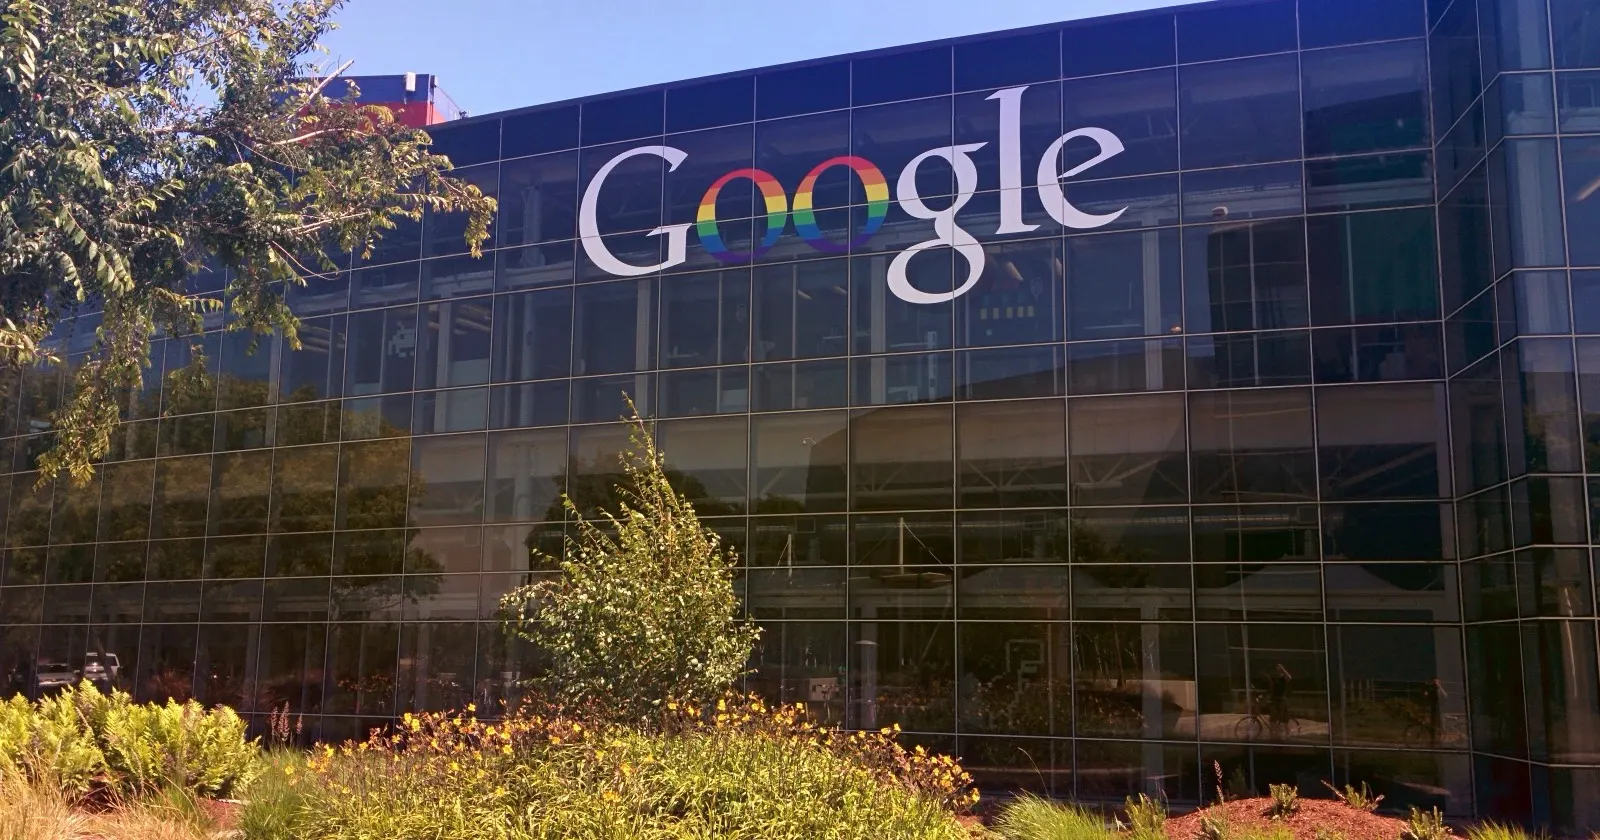
Alphabet (GOOG) was the number 4 US company by market value on 5 November 2026, at about $3.5 trillion, on the companiesmarketcap.com ranking. Its figures come from its SEC filings, read on 5 November 2026. A figure a filing lacks is marked as not reported.
What Alphabet sells
Alphabet owns Google, YouTube and Android. Most of its money comes from advertising shown next to searches and videos. It also sells cloud computing and storage, and it owns self-driving car company Waymo and other long-shot projects.
The finances
- Revenue: $403 billion in the year to 31 December 2025 (10-K), up 15.1% from $350 billion. The 12 months to 30 September 2026: $471 billion. Double-digit growth is solid at this size.
- Net income: $132 billion in the year to 31 December 2025 (10-K), against $100 billion a year earlier; net margin 32.8%. The 12 months to 30 September 2026: $236 billion. About $33 of every $100 of sales stayed as profit, a very high margin.
- Free cash flow: $73.3 billion in the year to 31 December 2025 (10-K), which is $165 billion of operating cash flow minus $91.4 billion of capital spending. The 12 months to 30 September 2026: $19.7 billion. That is the cash left after running and equipping the business.
- Cash and debt: $56.3 billion in cash and $126 billion of debt (10-Q, 30 September 2026). It owed more than it held in cash.
- Share count: 12.23 billion average diluted shares in the year to 31 December 2025 (10-K), down 1.7% from 12.45 billion. Fewer shares, usually from buybacks, make each one a bigger slice.
One thing to notice: Capital spending rose from $91.4 billion in 2025 to $159.8 billion over the 12 months to 30 September 2026. Alphabet has two listed share classes, GOOG and GOOGL, and both belong to the one company in these numbers.
What holding it would have done
From our free long-term checker, which looks back only:
- Past returns, price only: 1-year -2% (SPY +10%), 3-year +113% (SPY +74%), 5-year +90% (SPY +62%), 10-year +630% (SPY +248%). That 10-year gain is 22.0% a year, against 13.3% for SPY.
- Worst fall: -44.6%, from the close on 18 November 2021 to the low on 3 November 2022 (350 days). Getting back to that high took another 448 days, to 25 January 2024. SPY's worst fall was -34.1%.
- How often holding ended higher: 80% of 1-year holds (worst -43%) and 100% of 5-year holds (worst +56%).
- Monthly buying against a lump sum: over the past 10 years, $100 a month ($12,100 in total) would have grown to $38,600. The same money in on day one would have grown to $88,310; in SPY, monthly buying ends at $24,571 and the lump sum at $42,078.
Price only: no dividends, fees or tax. Daily closes, 10 November 2016 to 3 November 2026. SPY is an S&P 500 fund.
What this does and does not tell you
A company can earn more and still see its shares fall, because the price already reflects what people expect. So the filings and the long test answer different questions, and neither says what comes next.
This is one company over one stretch of history: an in-sample look at the past, not a promise. It is general information, not a call to buy or sell GOOG, and it sets no price target.
More
The other 24 are in The 25 biggest US stocks. To check any other stock, use the long-term checker.
About Tickfloor
What is Tickfloor?
Tickfloor is a stock and crypto indicator for beginner and self-directed traders: it scores any stock or coin out of 10 from ten common chart checks, and publishes every backtest behind the method, the failed ones too. So far that is 1,342 strategies tested, and 0 passed the luck check.
Is Tickfloor free?
Yes, to start. You get 3 free scores a day with a free account. No card. The example read, the evidence and results pages, the glossary and the first two course lessons need no account at all. Paid passes unlock the rest and are listed on the pricing page.
How is Tickfloor different from other indicator sites?
Tickfloor shows its own test record next to the score, failures included: 1,342 strategies in 77 families against a benchmark that pays no costs. 265 finished ahead on the raw number and 0 of 1,774 tests were left once luck was allowed for. The score describes what a chart shows today. It is not a tip or a prediction.
Can I backtest my own strategy on Tickfloor?
Yes, with a pass. The Backtest Lab runs your own daily rule on historical data and shows every trade after costs, with a receipt you can share. Each run is labelled exploration: one look at the past, not a forecast.
General information, not personal advice. Tickfloor does not hold a financial services licence.