What RSI actually tells you: we tested 43 versions of it
A plain-English guide to the 0-to-100 line under almost every price chart, plus how 43 RSI rules did in our test of 1,342 trading rules.
You have probably seen it under a price chart: a wiggly line that stays between 0 and 100. That is RSI, short for Relative Strength Index. The textbook rule of thumb says a reading above 70 means the price has run too far (traders say "overbought") and a reading below 30 means it has fallen too far ("oversold"). So the rule is to sell above 70 and buy below 30. Does that hold up? We tested it on past prices.
What the number measures
J. Welles Wilder Jr. introduced RSI in 1978. It looks back over the last 14 days (14 hours on an hourly chart) and asks one question: have the up moves been bigger than the down moves?
Here is the maths with made-up numbers. Say gains over those 14 days averaged 0.9% and losses averaged 0.3%. The gains were 3 times bigger, so RSI = 100 minus 100 ÷ (1 + 3) = 75. The real formula smooths the averages a little, but the idea is the same.
A 75 means the price has mostly been going up lately. Around 50 means ups and downs have been about even. "Overbought" and "oversold" sound like warnings, but they only mean "rose a lot lately" and "fell a lot lately".
What RSI can tell you
It tells you how hard the price has been pushed one way recently. Think of a speedometer: it shows how fast the car has been going and says nothing about the road ahead. If a stock shows 78, the useful question is why it has run so hard. Was there news? Is the whole market up?
What it can't tell you
- That the price has to turn around. In a strong run, RSI can stay above 70 for weeks.
- How far the next move will go.
- Anything the price has not already done. RSI is built from past prices, so it is always a little late.
- Whether 70 and 30 mean anything special. They are a convention from 1978, not a law.
We tested it
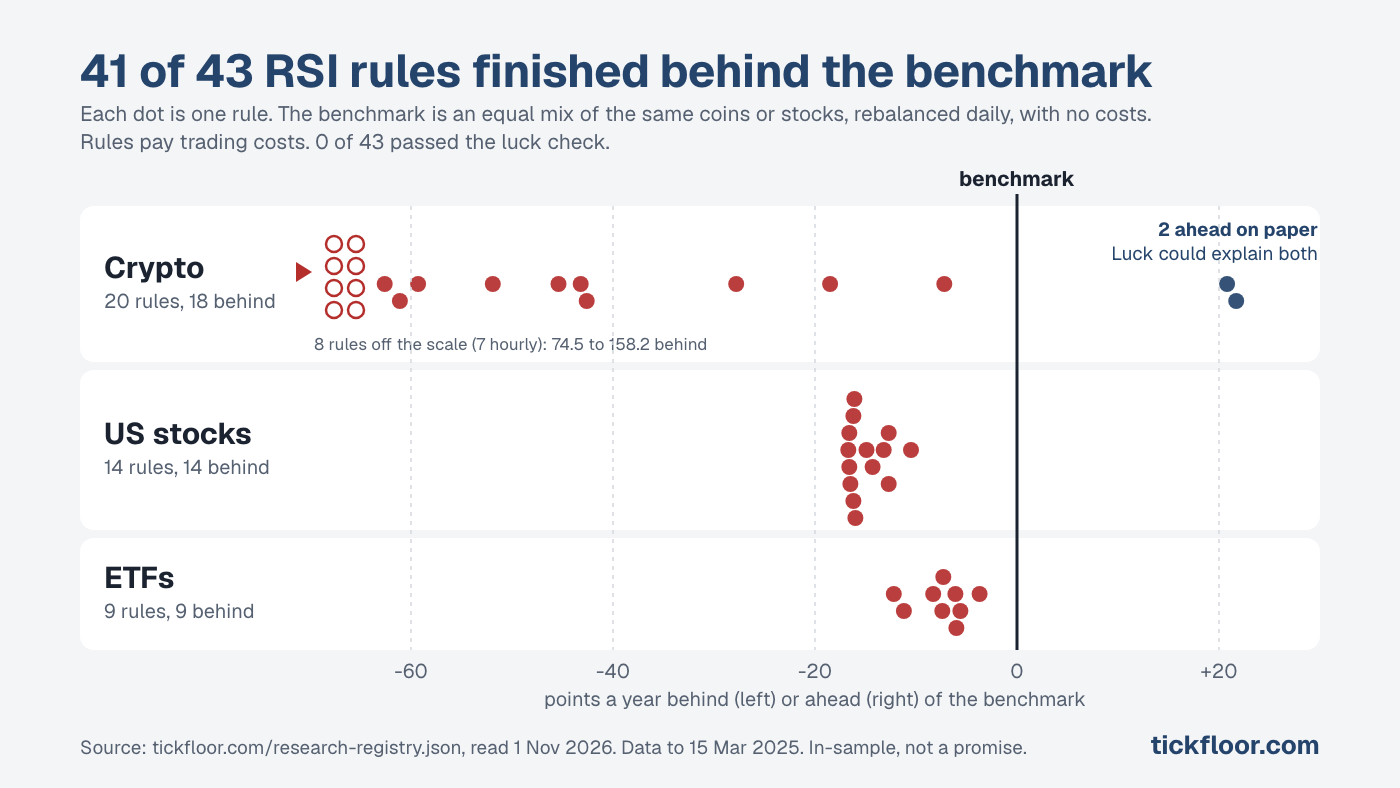
We have tested 1,342 trading rules on past prices of coins, ETFs (funds that hold a basket of stocks) and US stocks. Each rule paid trading costs. Each was compared with a benchmark: an equal mix of the same coins or stocks, rebalanced every day, with no costs charged. Searching our public results file for "RSI" turns up 43 rules. They include the classic buy-below-30, sell-above-70 rule, dip buying with a 2-day RSI, RSI divergence (the price makes a lower low but RSI makes a higher one), and the opposite idea: buy when RSI goes above 70.
Here is what came back:
- 41 of the 43 finished behind the benchmark.
- The classic 30/70 rule finished 10.5 points a year behind on 40 US stocks and 42.6 behind on 18 coins. On $100, a gap of 10.5 points is roughly $10.50 a year.
- The opposite idea, buying when RSI goes above 70, also finished behind: 14.3 points a year on the stocks and 7.2 on the coins.
- Two rules finished ahead on paper, both on coins. One watches RSI crossing 60 and 40. The other waits for 2 of 3 chart checks, RSI among them, to agree. Results that good turn up by chance about 1 time in 4, so we do not count them as proof.
- After our luck check, none of the 43 passed. Neither did any of the 1,342.
Flip a thousand coins ten times each and about one will come up heads every time. Test a thousand rules and some will look great by accident, so the luck check adjusts for how many we tried.
That does not mean no RSI rule can work. We tested particular versions on past data up to March 2025, and a smarter one might do better. We cannot tell from here. The rules also pay trading costs while the benchmark does not, which tilts the test against them. When we re-ran 211 rules from the full set with zero costs, 196 still finished behind. All of this is an in-sample backtest on past data, not a promise: it measures old prices we already had, not what happens next.
See RSI next to nine other checks
Tickfloor's free score reads ten common chart checks, RSI among them, and shows what they say about a stock or coin right now. It is not a prediction and it is not advice to buy or sell. Type any ticker, like AAPL or BTC. You get 3 free scores a day with a free account, no card: try the free score. The evidence page links to the full list of rules we tested, failures included, and the RSI strategy test has the detail for the classic rule.
About Tickfloor
What is Tickfloor?
Tickfloor is a stock and crypto indicator for beginner and self-directed traders: it scores any stock or coin out of 10 from ten common chart checks, and publishes every backtest behind the method, the failed ones too. So far that is 1,342 strategies tested, and 0 passed the luck check.
Is Tickfloor free?
Yes, to start. You get 3 free scores a day with a free account. No card. The example read, the evidence and results pages, the glossary and the first two course lessons need no account at all. Paid passes unlock the rest and are listed on the pricing page.
How is Tickfloor different from other indicator sites?
Tickfloor shows its own test record next to the score, failures included: 1,342 strategies in 77 families against a benchmark that pays no costs. 265 finished ahead on the raw number and 0 of 1,774 tests were left once luck was allowed for. The score describes what a chart shows today. It is not a tip or a prediction.
General information, not personal advice. Tickfloor does not hold a financial services licence.