Indicators
How an EMA crossover works, with the arithmetic, and how it did on 40 stocks and 18 coins
How an EMA crossover is built, with the arithmetic, and how the 9/21 cross and golden cross did on stocks, ETFs and crypto.

The 9/21 cross and the golden cross, built up from one day of prices and then tested.
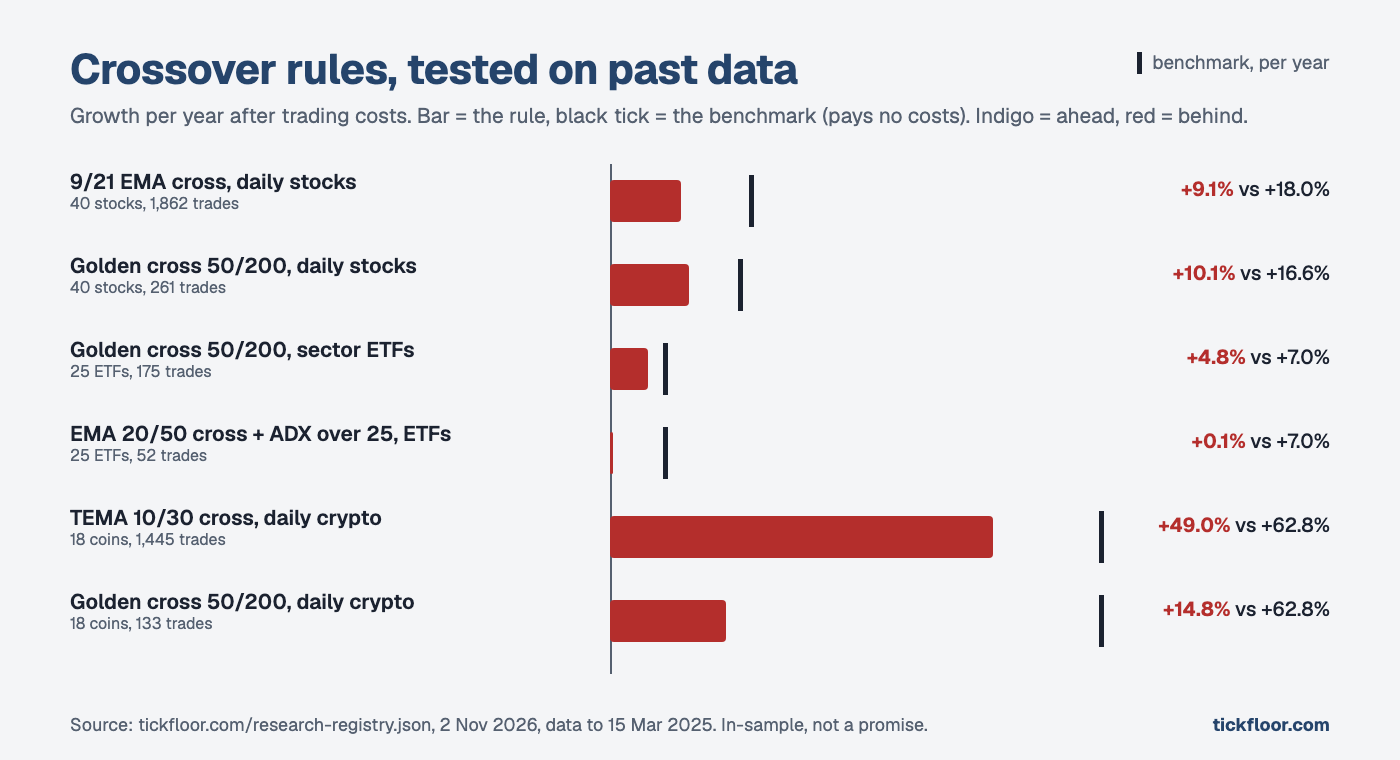
On 40 large US stocks, the 9/21 EMA crossover grew 9.1% a year after costs. The benchmark grew 18.0%. The golden cross, the famous one, did 10.1% against 16.6%. Here is how both are built, so you can see why they behave this way.
Start with one day
An exponential moving average (EMA) is an average that leans toward recent prices. Each day, it moves a fixed share of the way toward today's price. For a 9-day EMA that share is 2 divided by 10, or 0.2. For a 21-day EMA it is 2 divided by 22, about 0.09.
Say yesterday's 9-day EMA was $100 and a stock closes today at $110. The new 9-day EMA is 100 plus 0.2 times 10, so $102. The 21-day moves less: 100 plus 0.09 times 10, so $100.91.
The fast one reacts. The slow one drags. That is the entire idea.
The crossover
When the fast line rises above the slow line, price has been rising lately faster than its longer drift. The rule says buy. When it drops back below, sell. The popular pairs are 9 and 21 for short-term charts, and 50 and 200 for the golden cross (buy when the 50 crosses above the 200) and its mirror, the death cross.
What the tests found
Growth per year after costs, rule against benchmark. The benchmark is an equal-weight mix of the same assets, rebalanced daily, and it pays no costs.
- 9/21 EMA cross, 40 US stocks, daily, 1,862 trades: 9.1% against 18.0%.
- Golden cross 50/200, 40 US stocks, 261 trades: 10.1% against 16.6%.
- Golden cross, 25 sector ETFs, 175 trades: 4.8% against 7.0%.
- EMA 20/50 cross taken only when ADX is above 25, 25 ETFs, 52 trades: 0.1% against 7.0%.
- Triple EMA 10/30 cross, 18 coins, 1,445 trades: 49.0% against 62.8%.
- Golden cross, 18 coins, 133 trades: 14.8% against 62.8%.
All six finished behind. The crypto golden cross is the widest gap: 14.8% against a benchmark that grew 62.8% a year.
Faster is worse
Hourly bars on 8 coins, same costs charged on every trade:
- 9/21 EMA, long only, 9,911 trades: 21.8% against 84.7%.
- 9/21 EMA, long and short, 21,714 trades: negative 51.3% against 84.7%.
- Golden cross on hourly bars (50/200 EMA), 1,393 trades: 93.2% against 84.7%.
More trades, more cost, worse result. The exception is the last line, which finished ahead by 8.5 points. Its p-value is 0.39, so a result like it would show up by luck about 4 times in 10, and the tests did not count it as significant.
What to take from it
Across all 1,346 strategies we tested, 266 finished ahead of the benchmark on the raw number. After correcting for how many we tried (Benjamini-Hochberg, across 1,778 tests), 0 passed. None of the crossover rules above is among the 266 except the hourly golden cross, and it was not significant.
We tested the usual settings, 9/21, 20/50, 50/200, and a triple EMA. We did not test other pairs, so we cannot say whether some pair does better. Whichever pair looked best would probably be luck, but that is a guess, not a result.
An EMA crossover is one of the ten kinds of input behind a Tickfloor score. You can try a free score on a stock or coin: 3 free scores a day with a free account, no card. The 9/21 test is in the 9/21 EMA cross test and the golden cross test is in the golden cross and death cross test.
These are in-sample backtests on past data, not a promise.
About Tickfloor
What is Tickfloor?
Tickfloor is a stock and crypto indicator for beginner and self-directed traders: it scores any stock or coin out of 10 from ten common chart checks, and publishes every backtest behind the method, the failed ones too. So far that is 1,346 strategies tested, and 0 passed the luck check.
Is Tickfloor free?
Yes, to start. You get 3 free scores a day with a free account. No card. The example read, the evidence and results pages, the glossary and the first two course lessons need no account at all. Paid passes unlock the rest and are listed on the pricing page.
How is Tickfloor different from other indicator sites?
Tickfloor shows its own test record next to the score, failures included: 1,346 strategies in 77 families against a benchmark that pays no costs. 266 finished ahead on the raw number and 0 of 1,778 tests were left once luck was allowed for. The score describes what a chart shows today. It is not a tip or a prediction.
Can I backtest my own strategy on Tickfloor?
Yes, with a pass. The Backtest Lab runs your own daily rule on historical data and shows every trade after costs, with a receipt you can share. Each run is labelled exploration: one look at the past, not a forecast.
General information, not personal advice. Tickfloor does not hold a financial services licence.