Research
Does the Santa Claus rally still work? The S&P 500 rose in 58 of 76 years, but only a little since 2005
The S&P 500 rose in 58 of 76 Santa Claus windows since 1950, averaging +1.25%. We tested it against random weeks, after costs, and by decade.
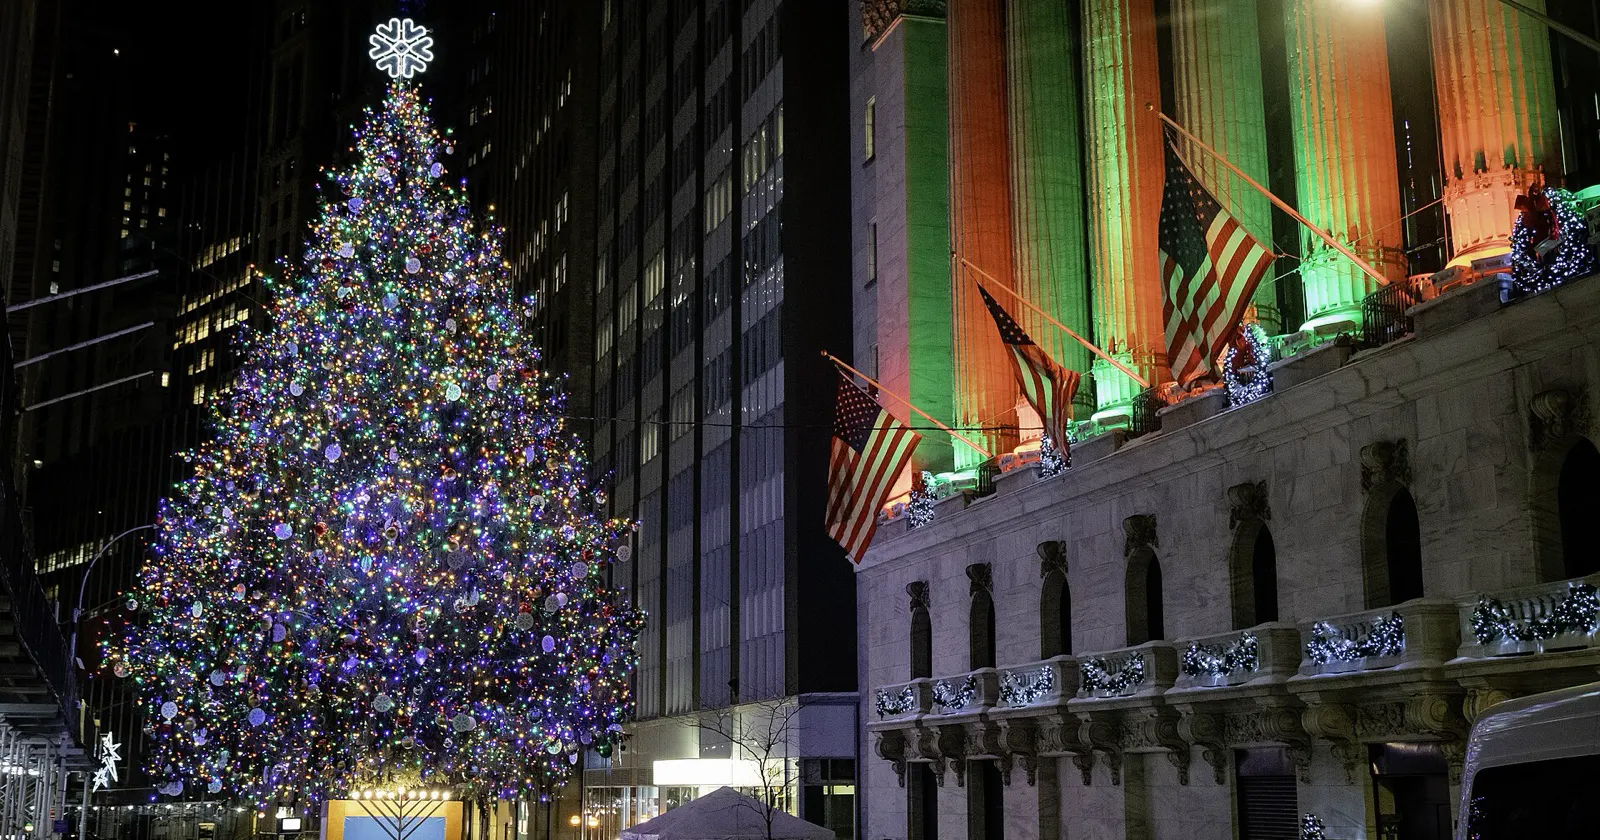
The "Santa Claus rally" is the idea that US shares tend to rise in the last few trading days of December and the first days of January. It comes up every year about now. We tested it on 76 years of S&P 500 prices.
The short answer: yes, it held up over the full history, and it is not luck. The S&P 500 rose in 58 of 76 windows (76%), against 58% for an ordinary 7-day stretch. But the gain is small, it has faded since 2000, and since 2005 it is not clearly different from chance.
The rule we tested
We used the version from the Stock Trader's Almanac, which is the one most often quoted: the last 5 trading days of December plus the first 2 trading days of January, 7 sessions in all. We bought at the close before the window opened and sold at the close of the second January session. We fixed that window before looking at any result, and we did not try other windows.
The data is the daily close of the S&P 500 index (^GSPC) from the Yahoo Finance chart API, downloaded on 6 November 2026. It is price only and leaves out dividends. The windows run from December 1950 to January 2026, 76 in total, and the file, our script and the download command are in the Tickfloor repository under scripts/news/santa-1106/.
What happened
- Up in 58 of 76 windows. The average was +1.25% and the middle result was +1.21%. The worst was 1999 into 2000 at -4.04% and the best was 2008 into 2009 at +7.45%.
- After costs, 56 of 76. We assumed 0.1% for the round trip (buying and selling), which is our own assumption and not a quote from any broker. After that the average is +1.15%.
- The most recent three windows were all slightly down: -0.88% (2023 into 2024), -0.53% (2024 into 2025) and -0.11% (2025 into 2026).
Compared with a normal week
Between 1950 and now there are 19,327 possible 7-session windows. Counting every one as a start day, the S&P 500 rose in 57.9% of them and the average change was +0.25%. So the Santa window did about five times the average.
To test whether that gap is luck, we drew 76 random 7-session windows from those 19,327 and took the average, 200,000 times (a permutation test). The random average matched or beat +1.25% in 0.03% of draws (p = 0.0003). Taking the 0.1% cost off the Santa window first gives p = 0.0008. A bootstrap on the 76 results puts the 95% range for the average Santa window at +0.75% to +1.76%. Each of those is against a base that paid no costs, so the comparison is deliberately hard on the Santa window.
Has it faded?
This is where the answer gets weaker. We split the 76 windows by period.
| Period | Up | Avg, p |
|---|---|---|
| 1950 to 1971 | 19 of 22 | +1.48%, 0.01 |
| 1972 to 2025 | 39 of 54 | +1.15%, 0.004 |
| 2000 to 2025 | 19 of 26 | +0.80%, 0.13 |
| 2005 to 2024 | 15 of 20 | +0.58%, 0.28 |
Avg is the average window before costs and p is the permutation test against random 7-session windows.
The Santa Claus rally was named in 1972. The 54 windows since then were not used to find the idea, and they still beat random weeks. But the edge has shrunk, and with 26 or 20 windows the later periods cannot be told apart from chance. A small sample like that would miss a real but modest effect, so this does not prove the rally is gone. It says we cannot show it.
Why our rule test failed anyway
Tickfloor already tested the Santa Claus rally as a trading rule, and that result stands: on a Nasdaq-100 ETF (QQQ) from 2005 to 2025 it returned -0.1% a year after costs, against 13.2% a year for holding the asset (see the Santa Claus rally claim). It did not pass our luck check.
The two results fit together. This note asks whether the seven days beat other weeks, and over 76 years they did. That test asks whether a rule that sits out the other 245 sessions of the year can beat staying invested. It cannot, because the rule is invested only 2.8% of the time and the rest of the year the market is moving without it. A +1.15% average gain on money held for a week is small beside a normal year for stocks. Our S&P 500 figure for 2005 to 2024 (+0.58% before costs, p = 0.28) is also near zero, in line with the QQQ test.
What this does and does not show
- Over 1950 to 2025 the Santa window was better than random weeks, and that is unlikely to be luck on its own. It is one window, set in advance from a published book, so we ran one test and not many. Most other calendar rules we tested as trading rules, such as sell in May and the January effect, did not pass either (evidence page).
- The average is small, and the recent record is weak. A 76% hit rate and a +1.15% average say nothing certain about this December.
- The test does not say why it happens. Year-end tax selling, holiday trading volumes and bonus money are all offered as reasons, and we did not test any of them.
- Price only. Dividends would add a little to every window, Santa and ordinary alike. Costs are an assumption.
- The windows do not overlap each other. The random windows we compared against do overlap, so the p-values are approximate.
The next window
By our count the 2026 window opens at the close of 23 December 2026 and closes on 5 January 2027, going by the usual NYSE holiday dates. We have not looked at that data and nothing here predicts it.
We apply the same standard to every claim we test: write the rule down first, compare it with a fair baseline, then correct for how many things we tried. Our method is on the luck check page and every result so far is on the evidence page.
Source: Yahoo Finance chart API, ^GSPC daily close, downloaded 6 November 2026; Tickfloor claim page for the Santa Claus rally (tested 2 October 2026). Figures are our own arithmetic on that file. Past results, not a forecast: they describe 76 earlier windows and say nothing certain about the next one.
About Tickfloor
What is Tickfloor?
Tickfloor is a stock and crypto indicator for beginner and self-directed traders: it scores any stock or coin out of 10 from ten common chart checks, and publishes every backtest behind the method, the failed ones too. So far that is 1,346 strategies tested, and 0 passed the luck check.
Is Tickfloor free?
Yes, to start. 1 free score, no account needed. A free account gets 3 free scores a day. No card. The example read, the evidence and results pages, the glossary and the first two course lessons need no account at all. Paid passes unlock the rest and are listed on the pricing page.
How is Tickfloor different from other indicator sites?
Tickfloor shows its own test record next to the score, failures included: 1,346 strategies in 77 families against a benchmark that pays no costs. 266 finished ahead on the raw number and 0 of 1,778 tests were left once luck was allowed for. The score describes what a chart shows today. It is not a tip or a prediction.
Can I backtest my own strategy on Tickfloor?
Yes, with a pass. The Backtest Lab runs your own daily rule on historical data and shows every trade after costs, with a receipt you can share. Each run is labelled exploration: one look at the past, not a forecast.
General information, not personal advice. Tickfloor does not hold a financial services licence.